If you’re a data professional interested in marketing, mastering customer segmentation and profiling should be at the top of your priority list. Not every product or service that your company makes will be right for every customer, nor will every customer be equally responsive to each of your company’s marketing campaigns. In the age of personalization, those who fall back on mass marketing techniques will fail, while those who work to understand their customers’ unique tastes and preferences will thrive.
If you want to be doing work that impacts your company’s profitability and bottom line (and gets you recognized as top talent!), customer segmentation is an absolute must because it helps generate MORE sales from your existing leads and customers.
Customer segmentation has been on my mind these days as I work on my business’s own marketing automation and product development. I realize I’ve learned a whole lot this past couple of months as I double down on marketing new offers, and I wanted to update this blog post to share this new information with you!
What you’ll get if you read this post:
- A conceptual training on a need-to-know data science skill
- A badass practice problem so you can apply your knowledge
- A step-by-step coding tutorial to help you master segmentation
- A FREE Downloadable source code + toy dataset for you to use on your own machine and apply at your own company
If you’re new around here, I’m Lillian Pierson and I regularly share resources and training for data professionals to uplevel their skills and start creating more profit for their organizations through data strategy so they can land their next promotion. To date, I’ve trained over 1 million workers on the topics of AI and data science and consulted for 10% of the world’s Fortune 500 companies!

This coding demonstration on customer segmentation and profiling is just one way to improve your organization’s bottom line. If you’re looking to boost your company’s profitability so you can start turning heads and getting noticed by your superiors, I have a fantastic resource for you to dive into.
My newest product, Winning With Data, helps you start leading strategic data projects that improve your organization’s profitability and get you the recognition you deserve to get promoted to Data Leader.
If you want to make big moves in your data career without having to wait until you have a decade of experience under your belt, this 30-day challenge and digital asset bundle will dramatically shortcut your path to becoming a highly-regarded data leader! Join Winning With Data and land your next promotion in 30 days or less ????????

So, what’s customer profiling and segmentation?
Simply put, segmentation is a way of organizing your customer base into groups. For marketing purposes, these groups are formed on the basis of people having similar product or service preferences, although segments can be constructed on any variety of other factors. Some popular ways to segment your customers include segmentation based on:
- Demographic characteristics,
- Psychographics,
- Desired benefits from products, and/ or;
- Past purchases
One benefit of such customer profiling and segmentation is that you can start targeting your customers more strategically based on the different segments you create.
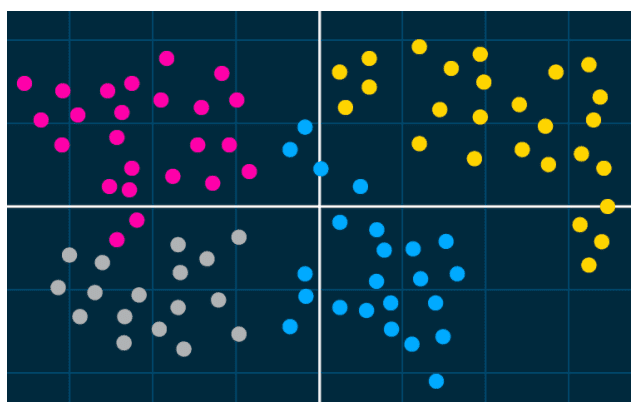
Before heading over to the case study, let’s have a look at how clustering is done.
Clustering analysis 101
By now you see how segmentation can help you better target specific audiences within your customer base, so let’s get into a little bit of data speak.
Want to access the full training on Python for segmentation? Access the entire training in my LinkedIn Learning course, Python for Data Science Essential Training – Part 2.
When you use segmentation analysis to break customers into similar groups (or “market segments“), the customer groups that result are called “clusters“. For a formal definition of clustering analysis, “cluster analysis is a class of statistical techniques that can be applied to data that exhibit natural groupings”.
With cluster analysis, your algorithm breaks customers into similar groups based on similarities in the attributes that describe the customer. So, for example, you could use one model to break your customers into separate groups based on how similar the customers are in terms of the following four attributes:
- Age range,
- Email responsiveness,
- Product channel affiliation, and;
- Income bracket.
Now, the similarities between your customers here would be calculated simultaneously – so the model will quantify how similar customers are based on all four attributes at the same time.
Since you’re not providing the model labels to instruct the it on how you want it to break the customers into groups, it has to look at each of the customers and figure out similarities for itself, then assign the customers into groups, as it defines them. That’s what we call unsupervised machine learning – we haven’t given the model any labels to describe the data it must learn from, so it has to discover groupings on its own.
In my experience, two places where I see a lot of clients struggle is that they either (1) have too much data and are overwhelmed with the idea of how to begin making sense of it or (2) they don’t have enough data about their customers to begin using data science to generate business value. The good news is, whether you fall into either of the above-two camps, you can begin using clustering analysis to improve your business’s bottom-line.
Want MORE ways to improve your business’s profitability (and get the recognition needed to land your next promotion)? That’s exactly what I help you with in Winning With Data – a 30-day challenge and digital asset bundle designed to help you level up your data career, the fast and fun way. Learn simple strategies to help improve your company’s bottom line and get you noticed – so you can start climbing the career ladder from data professional to data leader in 30 days or less ????????
You can easily improve your organization’s bottom line with clustering analysis because it’s easy to deploy on survey data. If your company is data-rich, then you’re sure to have lots of customer survey response data sitting around. If your company is data-poor, it’s fairly easy to create a survey and begin getting your customers to provide feedback.
Once you have your data source(s) pinned down, it’s not hard to use clustering analysis on your survey response data to group survey respondents into clusters.
Now that you understand a bit of the background on what customer profiling and segmentation is and how you can use it, let’s dig a little deeper into how clustering algorithms work.
Essentially, the primary method for classifying your customers into groups requires that the algorithm compute a quantitative distance value for similarity and dissimilarity between customers. Frankly, the algorithm has no way of knowing whether it’s grouping customers, or fruit, or any other type of item. It just looks at the data and uses math to find patterns. In the case of customer profiling and segmentation, each customer is described by a “row” in a data table (otherwise called an “observation“, a “case“, or a “record”).
So the algorithm goes in and calculates mathematical distances between rows, where each row represents a customer in this scenario. There are several mathematical methods from which to choose when instructing the algorithm on how to calculate similarity between customers, and this is an important choice to make. For this demo, however, we’ll be calculating similarity based on the Euclidean distance.
The Euclidean distance metric
The Euclidean distance metric is calculated according to the following equation:
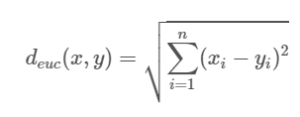
To make things clear, let’s look at a quick example.
Imagine you have a small sample of data that describes three customers. These three customers were each asked two questions:
- How much money do you spend on expensive hotels?
- How much money do you save?
The customers are asked to rate themselves between 1 to 7, where 1 indicates that the customer spends the least amount of money whereas 7 indicates the customer spends the most amount of money. So, 1 – 7 is the scale of measurement, and each of the customer’s responses are categorical (in other words, they can only rate themselves as belonging to one class, out of seven classes total)
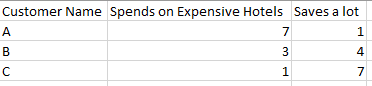
When the Euclidean distance is calculated between customers A, B, and C, you can see that the distance between customer B and C is less than the distance between customer B and A.
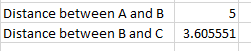
This means that customers B and C are more similar than are customers B and A. You use these distances to segregate these customers into groupings based on similarity in their responses…makes sense, right?
The K-Means algorithm
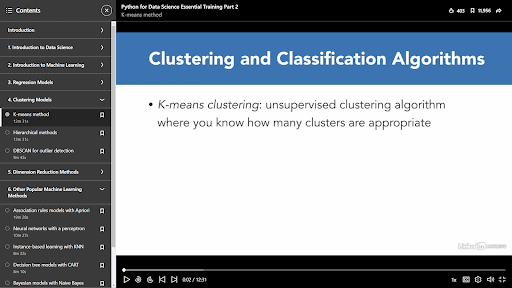
Now that you see how the distance between customers is calculated, let’s look at how to create clusters from these distances. For data scientists, we know that K-means clustering is an unsupervised clustering algorithm and that it belongs to the non-hierarchical class of clustering algorithms.
Want to skip ahead and just get access to the code? Download the free Python notebook in one-click using the form below!
Want to access the full training on Python for segmentation? Access the entire training in my LinkedIn Learning course, Python for Data Science Essential Training – Part 2.
But I imagine that some of the people reading this aren’t data scientists, so if that’s you, don’t worry. You don’t need to get into the nitty-gritty details right now – this is just an intro to customer profiling and segmentation, after all. Suffice it to say, the advantages of K-means over other clustering algorithms are:
- K-means method is appropriate for large data sets
- K-means is able to handle outliers extremely well
There are four main steps to that the K-means algorithm follows when you deploy it. Those are:
- We start off by picking a random number of clusters K. These form the centers for the clusters (aka; the “centroids“).
- In step two we assign the centroids a value taken from any observation. This is done by calculating the Euclidean distance between the centroid and the observation.
- Now, we compute the distance between the centroid and the nearest observations, and then average those out. This gives us the new values for the centroid. This ensures that the total intra-cluster variation (aka; total within-cluster variation) is minimized.
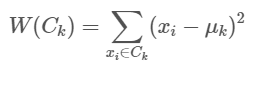
- Repeat Step 2 and 3 until none of the cluster assignments change. And the within-cluster sum of squares is at the minimum value. The within-cluster sum of squares is calculated by the following equation:
Determining the number of clusters
Now that we know how the clusters are computed we can start implementing the algorithm. However, we are missing one vital piece of information! We must determine the number of clusters to be used. There are various methods to figure this out. W=In this demo, we’ll be using the elbow method. This method works according to the steps described below:
- Start by computing the cluster algorithm for different values of K.
- For each value of K, we calculate the total within-cluster sum of squares.
- We plot the number of clusters against the within-cluster sum of squares
- We choose the number of clusters where the bend is prominent – this area is the point where we know that adding more clusters does not add more meaningful information.
A customer profiling and segmentation Python demo & practice problem
Now that we’ve covered the inner workings of k-means clustering, let’s implement it in a practice problem.
Get access to the full code so you can start implementing it for your own purposes in one-click using the form below!
Download the free Python Notebook ????????
Consider that you’re a marketing manager at an insurance firm and that you want to customize your offerings to suit the needs of your customers. You’ve decided to try out customer profiling and segmentation. After much thought, you decide on the two factors that you think the customers would value the most. Those are:
- A savings on premium paid
- The local availability of nearby insurance agents
The importance of these factors will be measured using something called the “likert scale”, wherein a rating of 1 represents not important and a rating of 7 represent very important. Sound familiar? ⍨
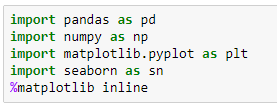
Now you ask your potential customers to take the survey. The survey data that I am using here is a randomized set of data. Assuming that you survey a lot of people, you are bound to see clear clusters. Let’s start off by importing the required libraries.
Next, we use pandas to read in the data set.
![]()
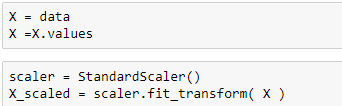
Since we are calculating Euclidean distance, we need to scale the data.
Now, let’s have a look at our data.
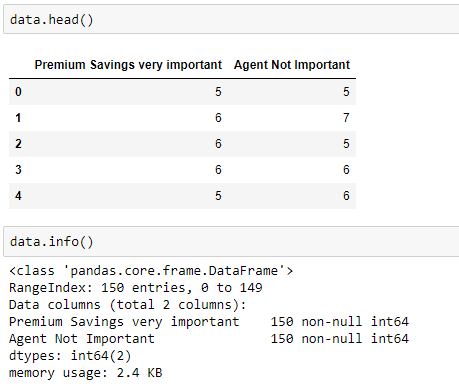
We have 150 observations without any null values, which is a good thing. Next, let’s scale the data.
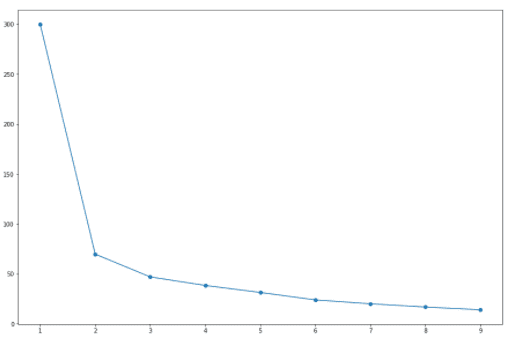
Before performing K-means clustering, let’s figure out the optimal number of clusters required. As discussed above, we’ll use the elbow method.
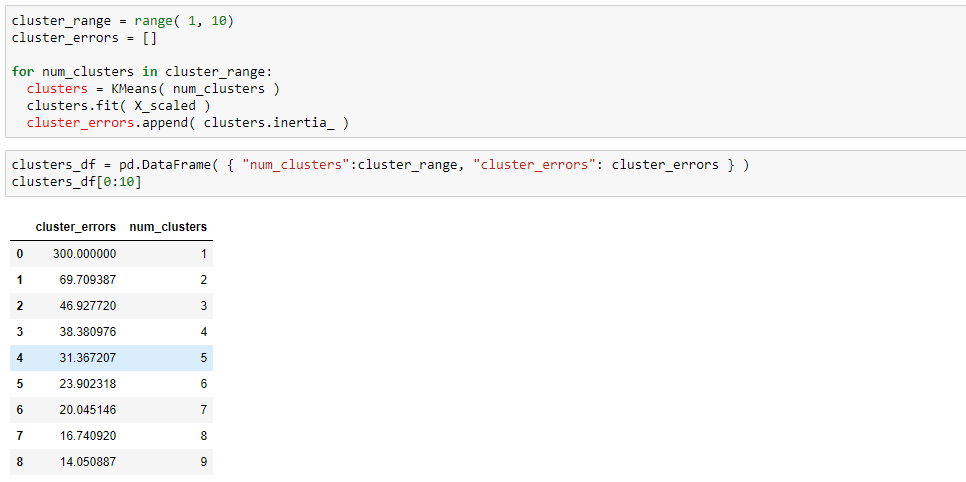
As you can see, there’s a massive difference between the WSS (within-cluster sum of squares) value of cluster 1 and cluster 2. So let’s go ahead and choose two clusters. Let’s plot the figure to get a clearer picture of what’s going on.
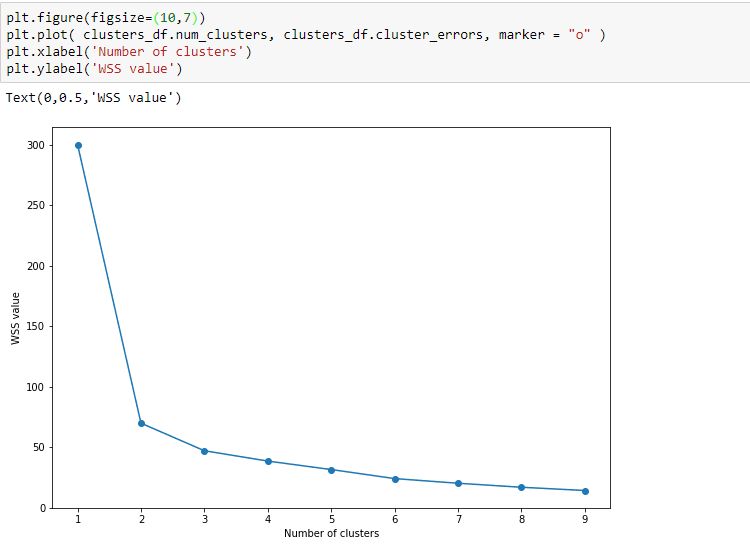
A clear bend can be seen at the 2nd cluster. Cool!
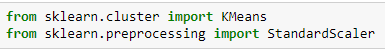
Next, fitting the k-means algorithm on the data…
means = KMeans(n_clusters=2)

kmeans.fit(X_scaled)

y_kmeans = kmeans.predict(X_scaled)
And, looking at the cluster determined for each observation…
y_kmeans

y_kmeans

array([0, 0, 0, 0, 0, 0, 0, 0, 0, 0, 0, 0, 0, 0, 0, 0, 0, 0, 0, 0, 0, 0, 0,

    0, 0, 0, 0, 0, 0, 0, 0, 0, 0, 0, 0, 0, 0, 0, 0, 0, 0, 0, 0, 0, 0, 0,

    0, 0, 0, 0, 0, 0, 0, 0, 0, 0, 0, 0, 0, 0, 0, 0, 0, 0, 0, 0, 0, 1, 1,

    1, 1, 1, 1, 1, 1, 1, 1, 1, 1, 1, 1, 1, 1, 1, 1, 1, 1, 1, 1, 1, 1, 1,

    1, 1, 1, 1, 1, 1, 1, 1, 1, 1, 1, 1, 1, 1, 1, 1, 1, 1, 1, 1, 1, 1, 1,

    1, 1, 1, 1, 1, 1, 1, 1, 1, 1, 1, 1, 0, 1, 0, 0, 0, 1, 0, 0, 0, 1, 1,

    0, 0, 0, 0, 0, 0, 1, 0, 1, 0, 1, 1])
Since there are only two clusters, we can have a look at the calculated centroid values:
centers = kmeans.cluster_centers_

centers


array([[ 0.79286835, 0.80281451],

    [-0.95610595, -0.96809985]])
Lastly, we’ll visualize the data with the clusters formed.
plt.scatter(X_scaled[:, 0], X_scaled[:, 1], c=y_kmeans)

plt.scatter(centers[:, 0], centers[:, 1], c='black', s=200, alpha=0.5)

plt.xlabel('Premium savings are important')

plt.ylabel('Agent not important')
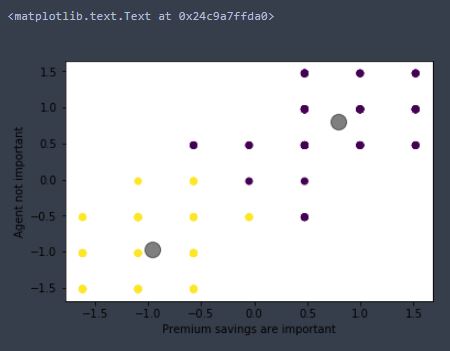
By looking at the above, you can easily see that there are two segments of potential customers. Those are:
- Segment 1 – Potential customers who want agents in their neighborhood and who are willing to spend more on premiums.
- Segment 2 – Potential customers who don’t really care whether there’s an agent in their neighborhood but do, however, demand to pay lower premiums on their insurance policies.
Do you want to have the code handy so you can use it at your own company and adjust it for your own purposes? Download the coding notebook in one-click using the form below ????????
If this was a real-world example, you could use what you learned in this analysis to help you craft targeted offers and optimized marketing messages.
There you have it! That was the basics of customer profiling and segmentation in Python.
So, what’s next?
First of all, pat yourself on the back from getting through a somewhat technical (yet necessary!) discussion on customer profiling and segmentation. As a next step, think about how you might go about applying what you’ve learned to your business. How can you go even further with your new knowledge?
If you’ve come this far, it means you’re serious about improving your organization’s bottom line and implementing profitable data projects. How about taking it up a notch and actually leading data science projects?
Coding courses and technical implementation aren’t the only ways to create an impact for your organization. If you find yourself wanting MORE out of your data career – more recognition, more impact, more income – it’s time to graduate from data professional to DATA LEADER.
Winning With Data is a 30-day challenge & digital asset bundle that dramatically shortcuts the path to becoming a highly-regarded data leader, even if you don’t have a decade of data implementation experience.
Join Winning With Data now and start taking decisive action to become a better data leader TODAY!