Market basket analysis in Excel can actually be a lot simpler than it would be in R or Python, depending on the size of your data. Either way, doing market basket analysis in Excel is a great way to introduce this analytical method to Data-Mania readers.
Making an Introduction to Cross-Selling Using Market Basket Analysis in Excel
This article starts out with some analogies, to familiarize you with the concepts of market basket analysis and cross-selling. Feel free to skip down the page if you’re just looking for the quick demo on how to do a market basket analysis in Excel.
They know how you fill your basket…
Before showing you how to do a market basket analysis in Excel, we need to make sure you understand the underlying concepts. On that note, imagine that one day you go to the nearby supermarket to buy some rat poison for the rat which has invaded your house. While you were searching for the product you wanted, you noticed mortein packs and mosquito insecticide bottles, just next to the rat poison. You ended up buying one bottle of mosquito spray even though you had no intention of buying that when you entered the market. You did not have the urgency to purchase it, so if you had not seen the mosquito repellent items, you surely would not have purchased them. Retailers probably knew that those who purchase anti-pest items also buy mosquito repellents most of the time, so they decided to place them next to each other, to encourage buyers.
For retailers, understanding this kind of customer behavior can result in a boost in sales. However, one cannot intuit this sort of thing.
While some people are fond of bread and butter for breakfast, some are also fond of eggs and bread, but which one will give you more profit? These questions are the basis behind the concept of market basket analysis.
Market basket analysis is the reasoning behind the art of arranging items in a store. Product placements should be done in such a way that the items frequently bought together are kept next to each other, so that customers are encouraged to buy them and so that this results in a boost in sales.
Selling and then cross-selling
One very famous example of market basket analysis has to do with beer purchases and diapers. An interesting study about married men coming to stores for purchasing diapers showed that they usually bought a set of beers to go with the diapers. The supermarket took this as a cross-selling opportunity and decided to keep the baby diapers aisle next to the beer aisle. They immediately witnessed a steep growth in men who came to buy baby diapers also purchasing beer. This method of cross-selling comes directly from market basket analysis.
When an association of two or more products is identified, keeping them next to each other will result in sales growth due to cross-selling of the products. However, keeping beer and diapers together may not result in a boost in diaper sales. This is because analysis showed that men who purchase diapers are likely to buy beer and not the other way around, implying a one-way cross selling relation. To solve for this confusion, market basket analysis involves what is known as ‘association rules’, to identify which products will experience cross-sells when two or more products are kept together.
Let’s understand the concepts of market basket analysis (MBA) and the related terms formally. One of the most popular techniques of cross selling, MBA involves identifying the combination of products which help in boosting sales. This combination reflects the products which are frequently bought by the customers together. This is why the term market basket analysis came about. It means analyzing what contents come in the market lists of different individuals. The combinations are denoted by using association rules in the form of A → B where A and B both represent one or more products. This rule means that customers who purchase A are likely to purchase B and thus keeping both of them together will result in B selling more. The question which comes to mind is, “How do we know whether such an association exists?” The apriori algorithm is a popular method to identify such associations. Before I explain the algorithm, I will go through ‘support’ and ‘confidence’ by demonstrating an example.
An example of market basket analysis
Taking a toy example. Let us assume that there are two products A and B which are the top selling products in a store. Almost 70% of the customers buy A as one of their products and 80% of the customers buy B as one of their products. The people who buy both A and B together are 60%. Do we have the association of A → B or B → A?We know that all the customers do not buy A. Also, all customers who buy A do not buy B. However, we cannot be sure if an association from A to B or B to A exists just by knowing the numbers. Here we define support and confidence. The support defines the number of transactions which involve a particular product or set of products. This means, support for A in this example is 70%, for B it is 80% and for both A and B it is 60%. Confidence denotes the precision with which we can say a transaction is true. We usually look at the confidence to calculate the validity of an association rule and then look at the support to see if it is viable to use the association rule in some manner. Let’s check the rules one by one
If customers purchase A, then they also purchase B (A → B)
We are already aware of all the support numbers. The confidence for A → B can be calculated using the formula:
Confidence(A → B) = support(A and B)/support(A)
Using Support(A and B) = 60% and support(A) as 70%, we get the confidence as 6/7 which is 85.7%. As it is apparent from the formula, confidence depicts the fraction of cases where the association rule holds out of the ones where customers have bought the products on the left hand side
If customers purchase B, then they also purchase A (B → A)
In this case, the confidence for B → A can be calculated using the formula:
Confidence(B → A) = support(A and B)/support(B)
Using Support(A and B) = 60% and support(A) as 80%, we get the confidence as 6/8 which is 75%. Overall we see that the confidence for B → A is lower than A → B so if we have to put our bets on one of the two, we will go for A → B association. However, since the association is quite high both ways, keeping the two products together can result in sales boost of both the products.
Why two verifications?
In real life, since we cannot include all the association rules, we typically decide thresholds for both support and confidence below which the association will not be considered. But why both support and confidence? Confidence in itself shows the validity of an association rule but it is not so useful if it applies to only a few customers or in other words, the support is low. This is where the apriori algorithm comes into picture. When you have multiple items in a store, there are a lot of possible associations. Moreover, the associations need to be checked for combinations of two products, then three products and so on as the level goes upward. The apriori algorithm eliminates possibilities much before we need to perform all such calculations. It works iteratively from selecting combinations of two products to upward level of combinations. At the first level, all associations where support and confidences are lower than the set thresholds are eliminated. From there, the upper levels are calculated by combining only the valid associations. As per the apriori rule, an association rule cannot have higher support and confidence than any of its subsets. Thus, the next level has much fewer associations to be tested. The same can be explained using the flowchart:
Among the final valid associations, the store owners decide strategies depending upon the level of support and confidence. For example, one can keep the items together to encourage buyers or alternatively sell products as a bundle or give discounts on purchasing the combination together.
This all makes sense, right? Ok, great – now let’s get into the demonstration of how to do a market basket analysis in Excel.
A practical demo of market basket analysis in Excel
We have described the concept of market basket analysis enough, but the learnings are made better by a practical example. You may be wondering, “”How in the heck can you do a market basket analysis in Excel?””. Well, that’s simple! We’ll use an Excel Add-on called XLminer. You can get that at Solver.com.
Let’s install XLminer(add-on) in Microsoft Excel which can be used to perform market basket analysis and work on a sample dataset. XLMiner can be downloaded from solver.com website as a 15-day free trial. There are separate links for 32-bit and 64-bit windows and the setup comes with a bundle of analytics tools. You can install the add on for Excel and try out the association rule option. Here’s how Microsoft Office 2010 looks like after installing the add-on.
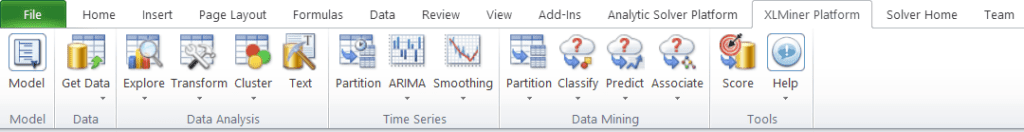
The currently open tab is the XLMiner Platform tab and has Analytics Solver Platform and Solver Home on both its sides which are also part of the bundle. We will be using the associate option which is 3rd from the right in the tab for our analysis. For demonstration, I will be using the extended bakery dataset for 75000 customers. The dataset is available online and can be downloaded from the link: https://wiki.csc.calpoly.edu/datasets/wiki/apriori
The apriori zip file contains datasets for 1000, 5000, 20000 and 75000 members. I will use the 75000-out1 file. The file contains 75000 rows where each row indicates the list of items brought by a unique customer. We have close to 50 items for these customers. Let’s look at a snapshot of the file.

The first row shows us the customer number and all numbers from the second row onwards show the basket size. For example, customer number 26 purchased items labelled 5,8,16,19,20,25,39 and 45 in his basket. The items are similarly labelled from 0 to 49.
Using XLMiner – The Steps
Now that you’ve installed XLMiner, you’re able to quickly and easily do a market basket analysis in Excel. Let’s click on the associate button and then the association rules option from XLMiner tab and understand the options.

The menu shows us some details about the data source which are automatically picked up to show our worksheet and data range. It also indicates that the number of columns are 9 which means that the maximum basket size which we will consider will be 9 items.
The dialogue box also selects the data in item list format. The parameters section is the most important section in this dialogue box for us. We have the parameters of minimum support and minimum confidence in this section. The default value for minimum support is 10% of the transactions and is 7,500 here. We also have a default value of 50% for the confidence.
Let’s tweak these values and set the confidence to be 90%. Since there are 50 items for 75,000 members, I will use 1,500 transactions as the minimum support(2%). Setting these parameters and clicking on OK will do the calculations for association rules and give us the results in the next sheet.
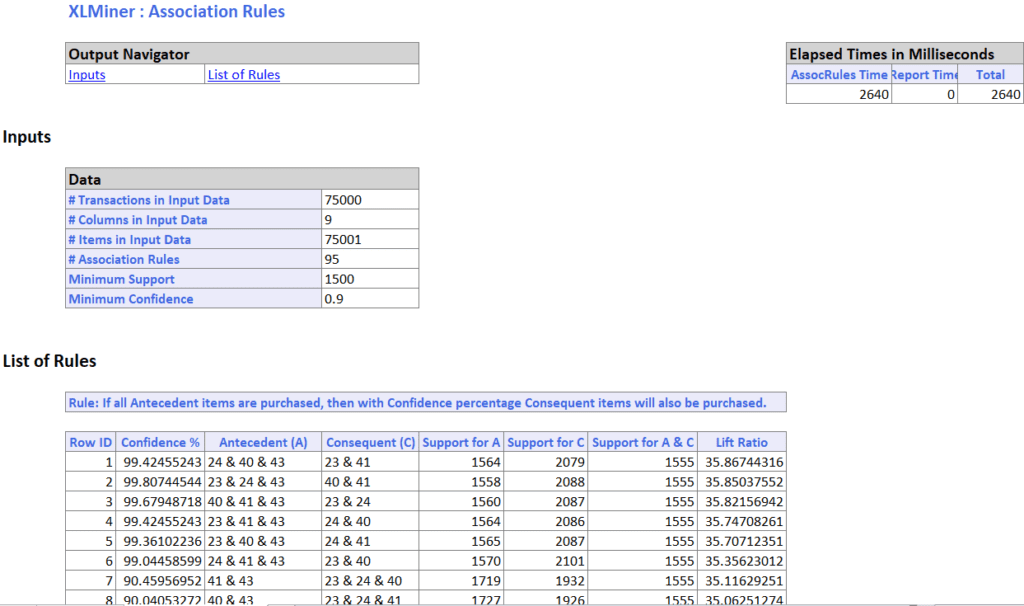
Now that we’ve finished running our market market basket analysis in Excel, it looks like XLMiner found 95 associations based on the settings we went for. All the rules are defined neatly in the list of rules section. We see that the confidence for some rules is very high and is above 99%. The Antecedent is the A part in A → B and Consequent is the B part. We also have the support numbers for A, C and both together. There are some interesting associations which includes 4 items as A and 3 items as C. We can also see that the support is more than 2000 in some cases and we may want to prioritize them. The maximum support reaches 3000 transactions. We also have three association rules where the confidence is 100%. The associations are sorted on the basis of decreasing lift ratio. After specifying support and confidence thresholds, lift ratio is typically used as it describes an insight into the benefit obtained by using the association compared to when the events were independent. This means that the lift ratio is the ratio of support of all items occurring together to the support of each of them independently. In other words, lift for an association A→ B will be support (A U B)/(support A * support B). Intuitively, a lift ratio greater than 1 means that if customers buy A, they are more likely to buy B. Similarly, a lift ratio less than 1 means that if customers buy A, they are less likely to buy B. A lift ratio of 1 means completely independent purchase of the items. Market basket analysis in Excel couldn’t get much simpler, huh?
Conclusion
How should one use the resulting association rules of this (or any other, for that matter) output? The top few associations are somewhat complicated and describe the same 5 products but if satisfied, they are almost definite associations as their confidence is more than 99%. Because the associations are sorted on the basis of decreasing lift ratio, these associations are credible as far as confidence or lift ratio is taken into account. They also have a similar range of support and are thus products that should be kept together. Towards the end of the list, we have some associations where the Consequent is a single item. These items can be good cases for bundling considerations. The Consequent can be bundled together with the Antecedent or some discount may be given on purchasing the set of items together so that customers are encouraged to purchase the product. Sometimes, boosting the sale of antecedent also results in boost in sale of the consequent (especially when confidence is near 100%). In cases when antecedent is a single items of few items then they can be promoted and more sale can be obtained. In this way, there are a lot of cross selling opportunities available. None of these strategies are sure-shot rules of thumb and are not exhaustive either. However, they do serve well in terms of giving a fair idea about the kind of techniques and ways in which market basket analysis can be done and used to drive business value. We hope that you’ve enjoyed seeing how to do a market basket analysis in Excel; Now, go out in the world and make your profits soar with effective strategies.